
Year End Guest Stats
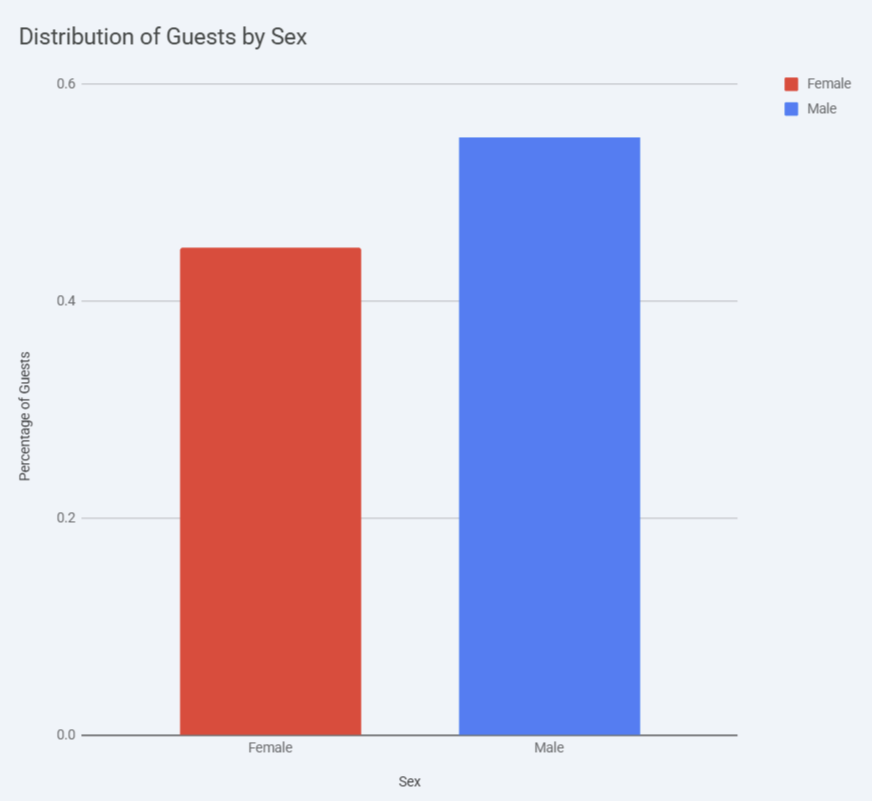
We’ve cared for about the same number of men & women: male 55.1% - female 44.9%.
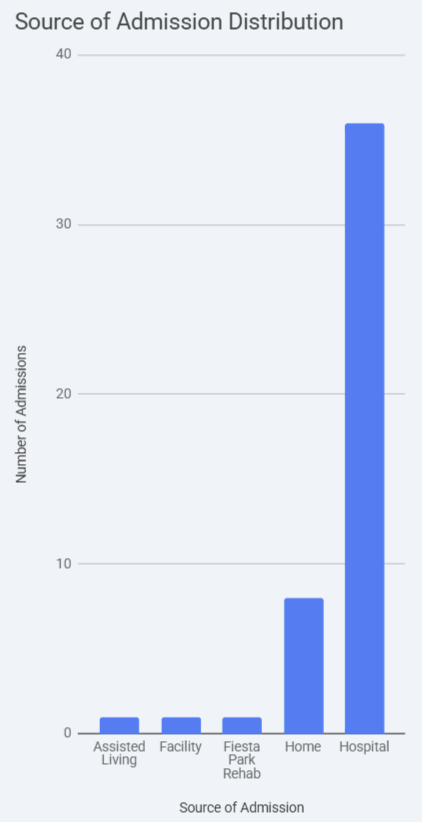
Most of our Guests were admitted from directly from the hospital.
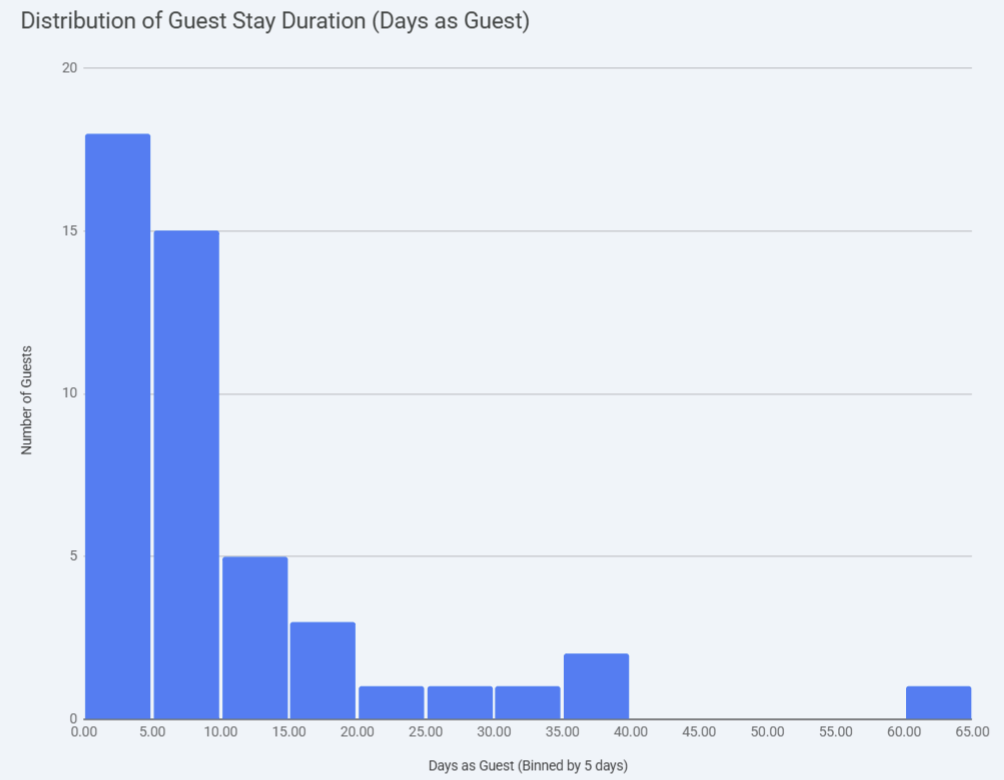
Most Guests stayed at our home less than 10 days - a few for 20 or more - one for over 60.
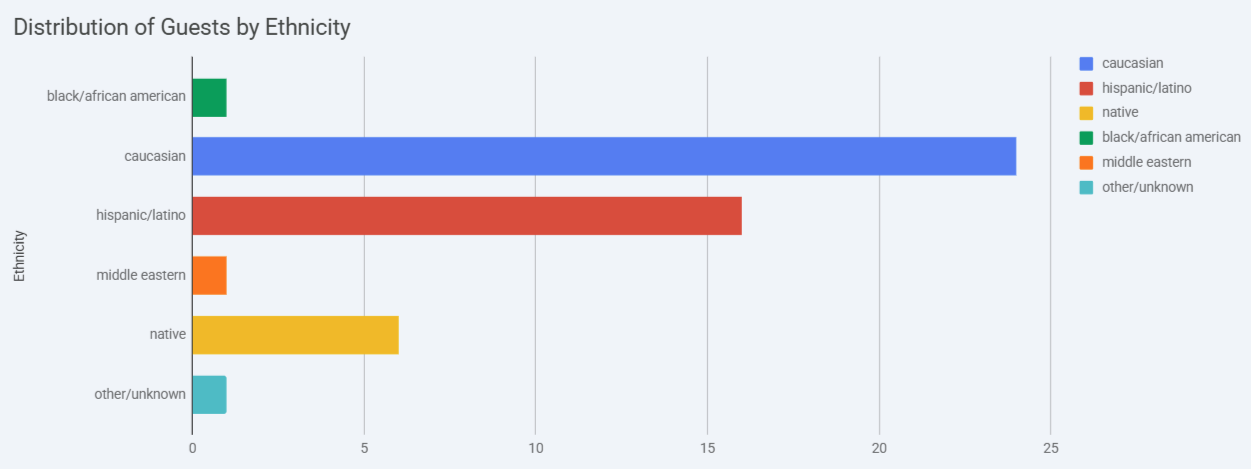
Ethnicity of Guests: Caucasian 49.0% - Hispanic/Latino 32.7% - Native 12.2% - Black/African American 2.0% - Middle Eastern 2.0% - Other/Unknown 2.0%.
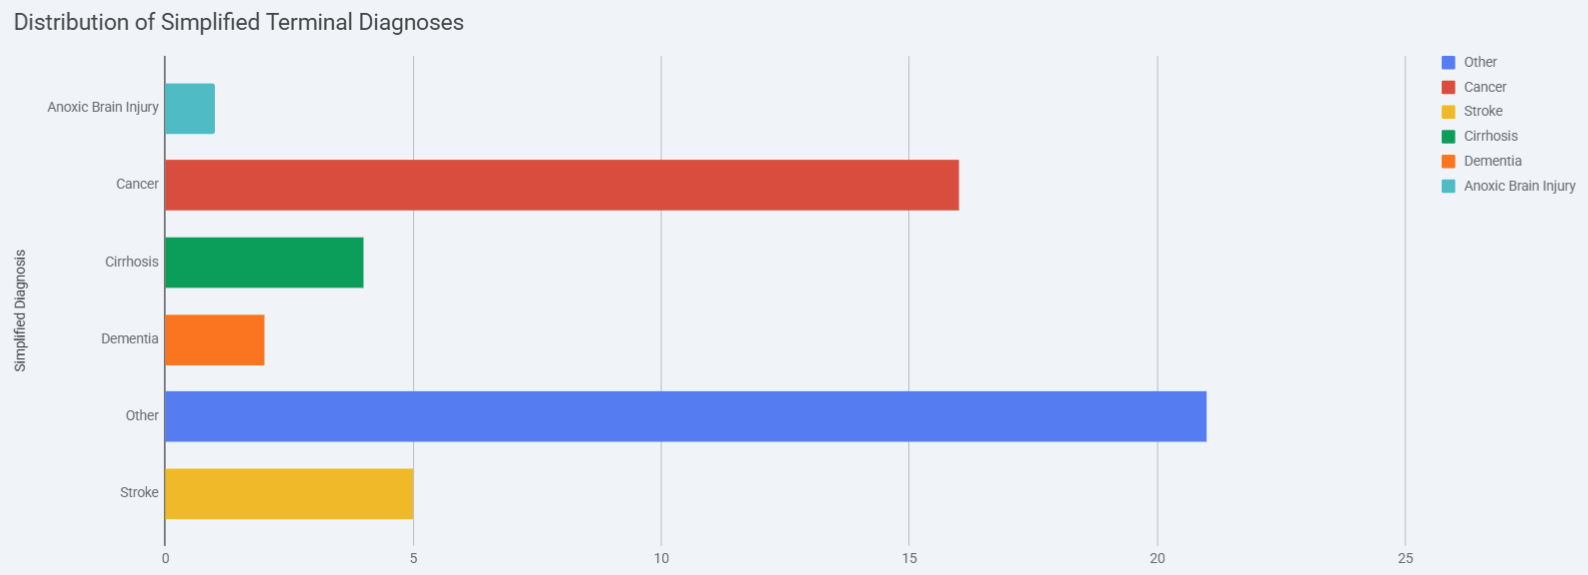
Terminal Diagnoses of Guests: Other 42.9% - Cancer 32.7% - Stroke 10.2% - Cirrhosis 8.2% - Dementia 4.1% - Anoxic Brain Injury - 2.0%

Religions of Guests: Catholic 51.0% - Other 22.4% - Non Religious 12.2% - Christian 8.2% - Not Specified 6.1%. The “Other” includes one person of each of the following belief systems: Greek Orthodox, Mormon, Hindu, & Muslim.